Histogram: Definition, Example, Excel, Benefits & Comparison
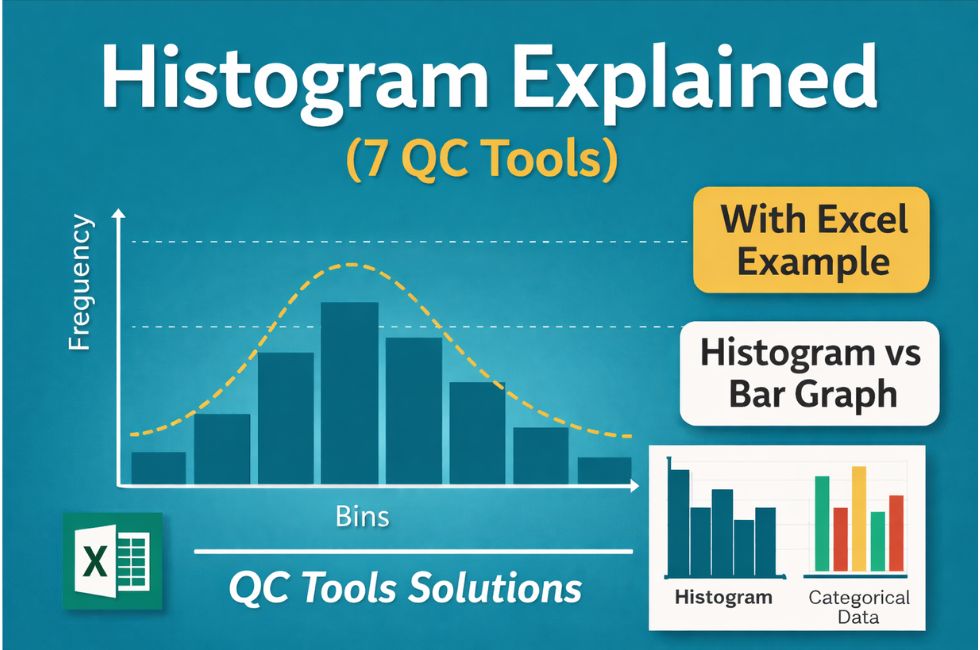
What is a Histogram Chart? A Histogram is one of the 7 Basic Quality Control (QC) Tools used to represent the distribution of numerical data. It shows how frequently data values occur within specific ranges called bins. In simple words, a histogram converts raw data into a visual form so that you can easily understand:• … Read more