Relation Diagram in New 7 QC Tools with Example
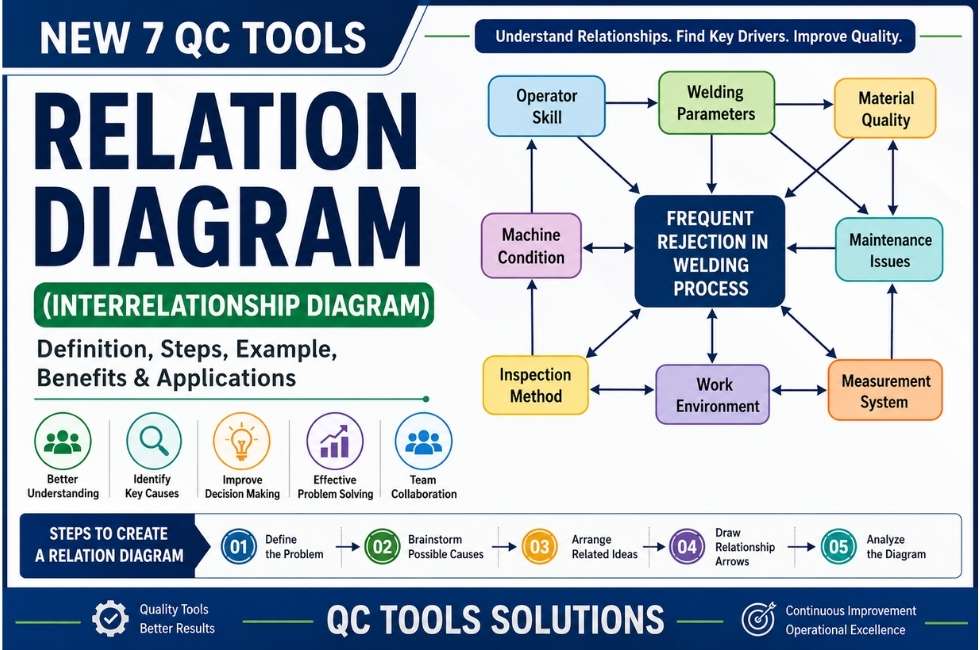
Relation Diagram in New 7 QC Tools A Relation Diagram, also called an Interrelationship Diagram, is one of the New 7 QC Tools used in quality management and problem-solving. It helps teams identify the logical relationship between different causes and effects in a complex problem. This tool is widely used in: A relation diagram encourages … Read more