Pareto Chart: 80/20 Rule, Examples & Excel Guide
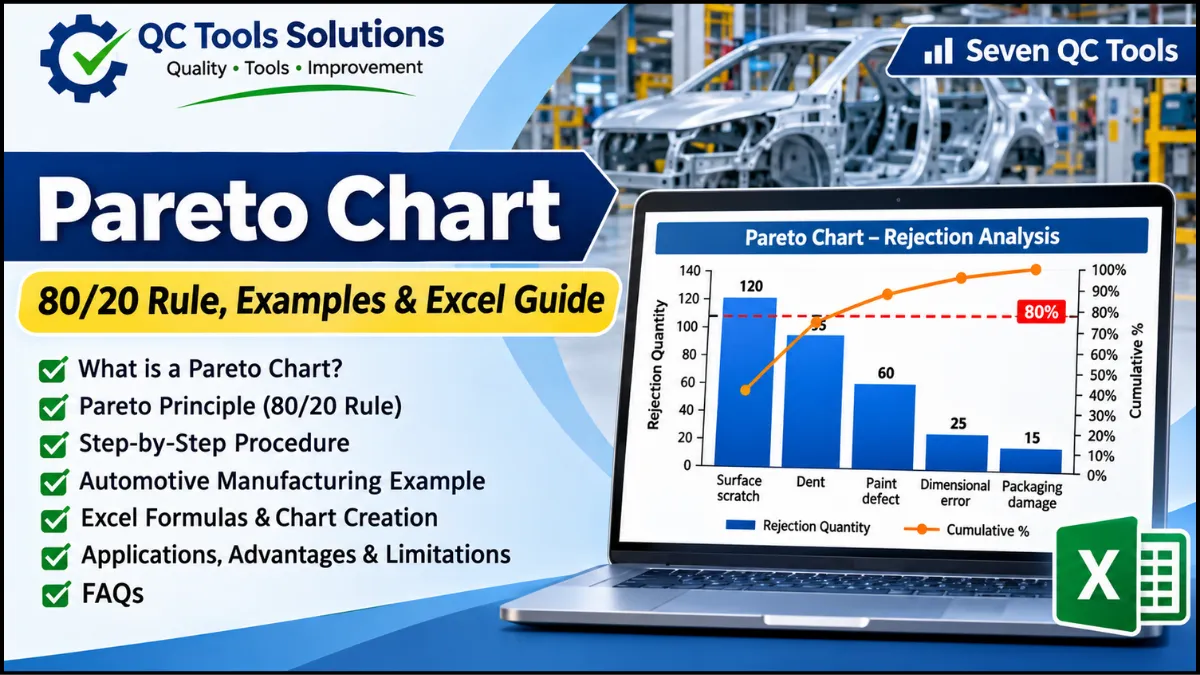
Pareto Chart illustrating the 80/20 rule, automotive manufacturing rejection analysis and Excel chart creation by QC Tools Solutions.

Pareto Chart: 80/20 Rule, Examples and How to Create in Excel A Pareto Chart is one of the seven basic quality control tools used to identify and prioritize the most significant problems affecting a process. It is based on the Pareto Principle, commonly known as the 80/20 Rule, which suggests that a small number of … Read more
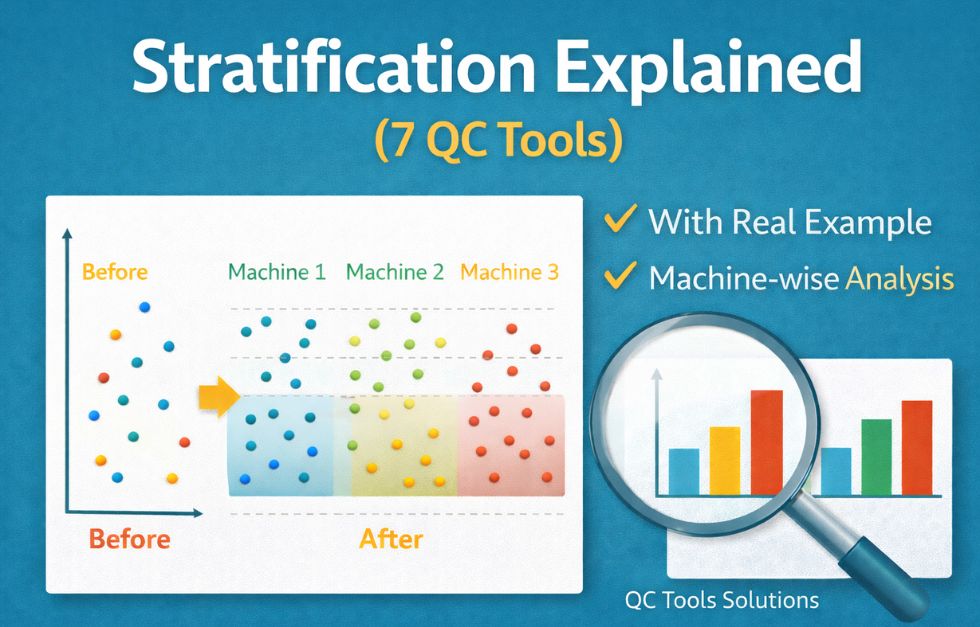
Stratification in 7 QC Tools (With Examples, Types & Diagram)

Stratification in 7 QC Tools

What is Stratification in 7 QC Tools? Stratification is one of the 7 Basic Quality Control (QC) Tools used to separate data into different groups (layers) to identify patterns and root causes of problems. In simple words, stratification means:👉 Dividing data into meaningful categories such as machine, operator, shift, material, or supplier. This helps in … Read more

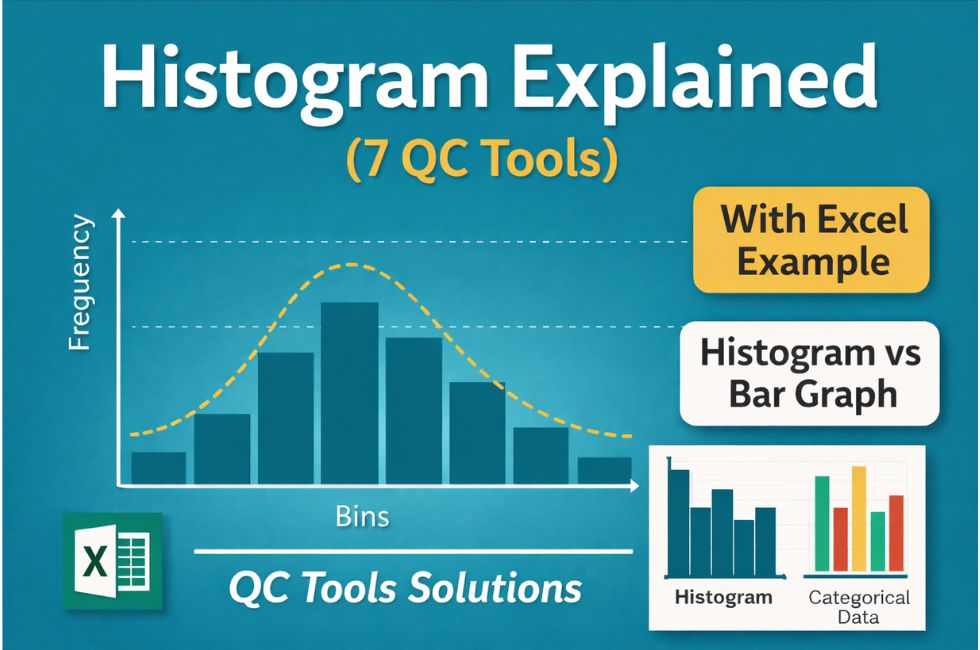
Histogram: Definition, Example, Excel, Benefits & Comparison

Histogram in 7 QC Tools

What is a Histogram Chart? A Histogram is one of the 7 Basic Quality Control (QC) Tools used to represent the distribution of numerical data. It shows how frequently data values occur within specific ranges called bins. In simple words, a histogram converts raw data into a visual form so that you can easily understand:• … Read more

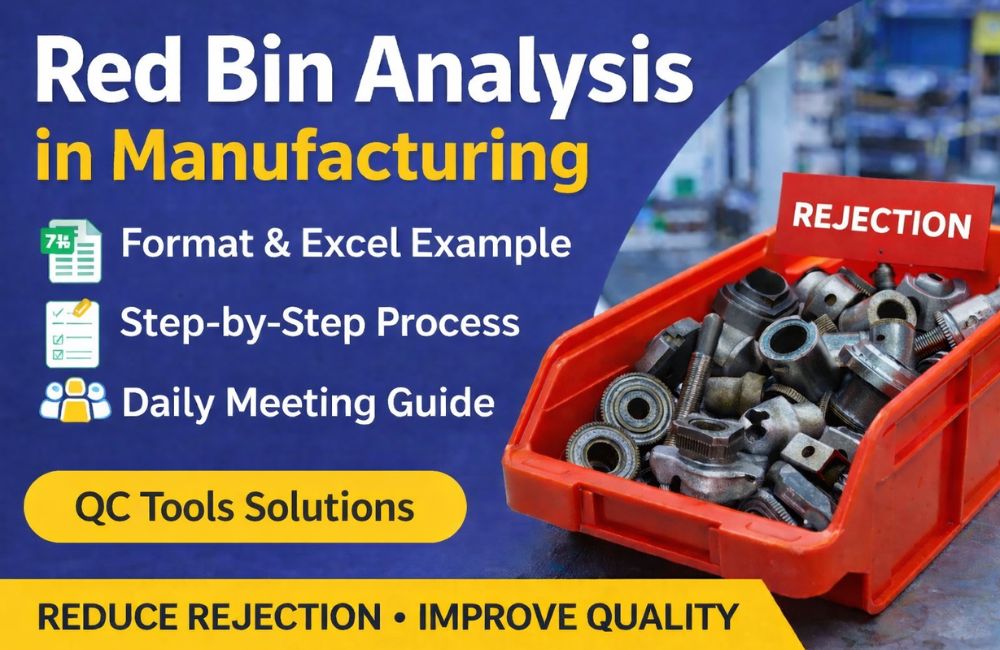
Red Bin Analysis in Manufacturing: Example & Guide (2026)

Red Bin Analysis

Are you struggling with repeated rejection in production? Red Bin Analysis is one of the simplest yet most powerful quality tools used in manufacturing industries to identify defects, analyze root causes, and prevent recurrence. If implemented properly, this method can significantly reduce rejection, improve process control, and strengthen your quality system. What is Red Bin … Read more