Relation Diagram in New 7 QC Tools
A Relation Diagram, also called an Interrelationship Diagram, is one of the New 7 QC Tools used in quality management and problem-solving. It helps teams identify the logical relationship between different causes and effects in a complex problem.
This tool is widely used in:
- Total Quality Management (TQM)
- Lean Manufacturing
- Root Cause Analysis
- Quality Improvement Projects
- Six Sigma
- Problem Solving Activities
A relation diagram encourages multi-directional thinking and helps identify the most influential factors affecting a process or problem.
- Relation Diagram in New 7 QC Tools
- What is a Relation Diagram?
- Relation Diagram Meaning in TQM
- Purpose of a Relation Diagram
- When to use a Relation Diagram?
- Benefits of Relation Diagram
- How to Create a Relation Diagram?
- Example of Relation Diagram
- Relation Diagram Symbols
- Difference Between Relation Diagram and Fishbone Diagram
- Applications of Relation Diagram
- Relation Diagram in New 7 QC Tools
- Tips for Effective Relation Diagram
- Common Mistakes While Preparing Relation Diagram
- Conclusion
- FAQs on Relation Diagram
What is a Relation Diagram?
A relation diagram is a visual management tool used to show the relationship between ideas, causes, and effects using arrows.
It is especially useful when:
- Many factors are interrelated
- The root cause is unclear
- A problem is complex
- Multiple departments are involved
The arrows in the diagram show which factor influences another factor.
Relation Diagram Meaning in TQM
In Total Quality Management (TQM), a relation diagram helps teams:
- Identify root causes
- Understand interconnections
- Prioritize corrective actions
- Improve decision-making
It converts confusing information into a structured visual format that is easier to analyze.
Purpose of a Relation Diagram
The main objectives of using a relation diagram are:
- Identify major causes of a problem
- Understand cause-and-effect relationships
- Find key drivers affecting performance
- Improve team understanding
- Support effective decision-making
When to use a Relation Diagram?
A relation diagram is used in the following situations:
1. Complex Problem Solving
When the problem has many interconnected causes and effects.
2. Root Cause Analysis
To identify the major driving causes behind a problem.
3. Planning Activities
During project planning or process improvement activities.
4. After Brainstorming
After preparing:
- Affinity Diagram
- Fishbone Diagram
- Tree Diagram
5. Cross-Functional Issues
When different departments influence the problem.
Benefits of Relation Diagram
Better Understanding of Problems
It helps teams visualize relationships clearly.
Identifies Key Causes
The diagram highlights the most influential factors.
Improves Team Participation
Encourages collaborative brainstorming and analysis.
Supports Decision Making
Helps prioritize improvement actions.
Enhances Logical Thinking
Develops analytical and systematic thinking.
How to Create a Relation Diagram?
Follow these simple steps to prepare a relation diagram:
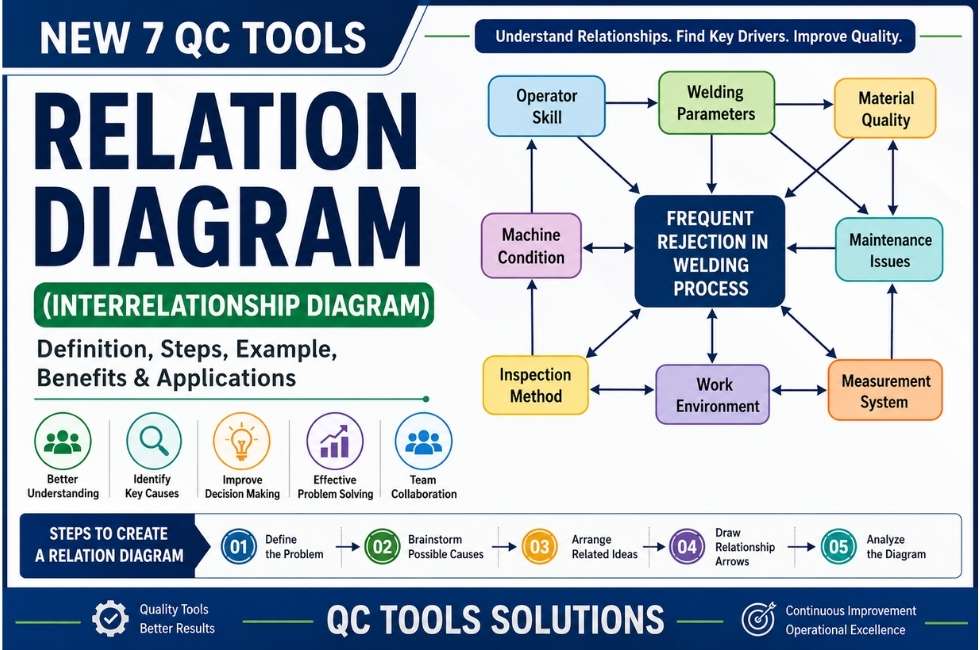
Step 1: Define the Problem
Clearly write the problem statement at the center or top of the chart.
Example:
Frequent rejection in Welding process.
Step 2: Brainstorm Possible Causes
Collect all possible causes related to the problem.
Examples:
- Operator skill
- Machine condition
- Welding parameters
- Material quality
- Maintenance issues
Step 3: Arrange Related Ideas
Place related ideas close to each other.
Step 4: Draw Relationship Arrows
Draw arrows from the influencing factor toward the affected factor.
The arrow direction shows:
- Cause → Effect
- Influence → Result
Step 5: Analyze the Diagram
Count:
- Incoming arrows
- Outgoing arrows
Factors with:
- More outgoing arrows → Major causes
- More incoming arrows → Final effects
Example of Relation Diagram
A company plans to install a new welding robot in the assembly line.
Different issues are identified:
- Operator training
- Space availability
- Power supply
- Programming skills
- Budget approval
- Maintenance planning

The team prepares a relation diagram to identify which factors have the maximum influence on successful robot installation.
Relation Diagram Symbols
| Symbol | Meaning |
|---|---|
| Box or Circle | Idea or factor |
| Arrow | Relationship or influence |
| Multiple Arrows | Strong influence |
Difference Between Relation Diagram and Fishbone Diagram
| Feature | Relation Diagram | Fishbone Diagram |
|---|---|---|
| Purpose | Shows interrelationship | Identifies possible causes |
| Arrow Direction | Multiple directional | One directional |
| Complexity Handling | Better for complex issues | Better for simple problems |
| Focus | Logical relationship | Cause categories |
Applications of Relation Diagram
Relation diagrams are widely used in:
- Manufacturing industries
- Automotive companies
- Quality management systems
- Lean manufacturing projects
- TPM activities
- Process improvement
- Six Sigma projects
Relation Diagram in New 7 QC Tools
The Relation Diagram is one of the New 7 QC Tools, also known as the 7 Management and Planning Tools.
The New 7 QC Tools are:
- Affinity Diagram
- Relation Diagram
- Tree Diagram
- Matrix Diagram
- Prioritization Matrix (Matrix Data Analysis)
- PDPC (Process Decision Program Chart)
- Arrow Diagram
Tips for Effective Relation Diagram
- Keep statements short and clear
- Avoid duplicate ideas
- Involve cross-functional team members
- Use brainstorming techniques
- Focus on logical relationships
- Highlight major influencing factors
Common Mistakes While Preparing Relation Diagram
- Drawing too many unnecessary arrows
- Using unclear problem statements
- Ignoring team participation
- Confusing causes with effects
- Not analyzing outgoing and incoming arrows properly
Conclusion
A Relation Diagram is a powerful quality management tool used to analyze complex relationships between causes and effects. It helps organizations identify root causes, improve teamwork, and take better decisions during problem-solving activities.
In Lean Manufacturing, TQM, and Six Sigma projects, the relation diagram plays an important role in identifying the most influential factors affecting quality and productivity.
For organizations aiming for continuous improvement, learning and applying relation diagrams can significantly improve analytical thinking and process understanding.
For deep drive about New 7 QC Tools: ASQ- Seven Management and Planning Tools
FAQs on Relation Diagram
What is a relation diagram?
A relation diagram is a quality management tool used to identify logical relationships among different factors in a complex problem.
Is relation diagram part of New 7 QC Tools?
Yes, relation diagram is one of the New 7 QC Tools used in planning and management activities.
What is another name for relation diagram?
It is also called an Interrelationship Diagram.
What is the main benefit of a relation diagram?
It helps identify the key driving causes in a complex problem.
Where is relation diagram used?
It is used in:
- TQM
- Lean Manufacturing
- Six Sigma
- Root Cause Analysis
- Process Improvement Projects