A Tree Diagram is one of the New 7 Quality Management and Planning Tools used to break down a broad objective into smaller, manageable tasks. It helps organizations move from a general goal to specific actionable steps in a logical and structured way.
In quality management systems such as ISO 9001, IATF 16949, Lean Manufacturing, and Six Sigma, tree diagrams are widely used for planning improvement projects, solving complex problems, and implementing corrective actions.
This tool visually represents the relationship between an objective and the means required to achieve it, making it easier for teams to plan effectively and ensure nothing is overlooked.
What is a Tree Diagram?
A Tree Diagram is a hierarchical planning tool that divides a large goal into progressively detailed levels of tasks, actions, or causes. It starts with a main objective and branches out into smaller elements until practical steps are identified.
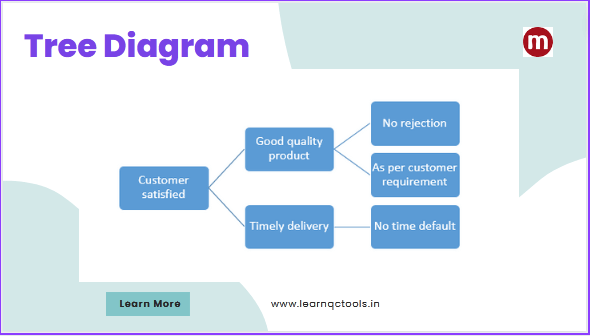
The structure resembles a tree:
• The trunk represents the main goal
• Branches represent major tasks or causes
• Sub-branches represent detailed actions
By decomposing a complex problem into smaller parts, teams can better understand the path to achieving the desired outcome.
Purpose of Tree Diagram in Quality Management
Tree diagrams are used when a goal appears too broad or complex to tackle directly. They help convert abstract objectives into concrete action plans.
Key purposes include:
• Planning quality improvement initiatives
• Breaking down strategic goals into operational tasks
• Identifying root causes and sub-causes
• Developing implementation plans
• Supporting decision making
• Ensuring no important step is missed
In manufacturing organizations, this tool is especially useful during corrective action planning, project planning, product development, and audit preparation.
When to Use a Tree Diagram
A tree diagram should be used when:
• A problem has many possible contributing factors
• A goal requires multiple coordinated actions
• You need a structured implementation plan
• Brainstorming results must be organized logically
• Cause-and-effect relationships need deeper breakdown
• Teams need clarity on responsibilities and actions
It is often used after tools like brainstorming, affinity diagram, or cause-and-effect diagram to convert ideas into a workable plan.
Types of Tree Diagrams Used in Quality and Management
Although the concept remains the same, tree diagrams may be applied in different ways depending on the purpose:
Goal-Means Tree
Breaks down an objective into methods required to achieve it.
Cause Tree
Explores causes and sub-causes contributing to a problem.
Work Breakdown Structure (WBS Style)
Divides a project into tasks and subtasks.
Issue Tree
Used in problem solving to analyze possible issues systematically.
How to Create a Tree Diagram (Step-by-Step)
Step 1: Define the Main Objective
Clearly state the problem or goal. Write it at the left side or top of the diagram.
Step 2: Identify Major Components
Determine the key tasks, causes, or categories needed to achieve the objective.
Step 3: Break Down Each Component
Divide each major element into smaller, more detailed actions or causes.
Step 4: Continue Decomposition
Repeat the breakdown process until practical and measurable tasks are identified.
Step 5: Review for Completeness
Ensure all necessary actions are included and logically connected.
Step 6: Assign Responsibility and Timeline
Convert the diagram into an actionable plan by assigning owners and deadlines.
Practical Example in Manufacturing
Objective: Reduce Customer Complaints
Major causes may include:
• Product defects
• Delivery delays
• Poor packaging
• Incorrect documentation
Further breakdown:
Product Defects → Process variation → Machine settings → Operator training
Delivery Delays → Production planning → Material shortage → Supplier delay
Poor Packaging → Inadequate packing method → Material quality → Handling issues
By continuing this breakdown, the organization identifies specific actions such as:
• Update machine parameters
• Conduct operator training
• Improve supplier coordination
• Introduce new packaging standards
This structured approach ensures that improvement efforts address real causes rather than symptoms.
Benefits of Using a Tree Diagram
Using a tree diagram provides several advantages:
• Simplifies complex problems
• Improves planning accuracy
• Enhances team understanding
• Supports systematic problem solving
• Prevents overlooking critical tasks
• Facilitates cross-functional collaboration
• Converts goals into actionable steps
Because of these benefits, tree diagrams are frequently used in continual improvement programs.
Tree Diagram vs Other Quality Tools
Tree Diagram vs Cause-and-Effect Diagram
A cause-and-effect diagram identifies possible causes of a problem, while a tree diagram breaks those causes into detailed actionable elements.
Tree Diagram vs Flowchart
A flowchart (PFD) shows process steps in sequence, whereas a tree diagram shows hierarchical relationships.
Tree Diagram vs Affinity Diagram
An affinity diagram groups ideas by similarity, while a tree diagram organizes them into structured levels.
Applications in ISO 9001 and IATF 16949
Organizations implementing ISO 9001 or IATF 16949 can use tree diagrams for:
• Risk-based thinking implementation
• Corrective and preventive action planning
• Project management
• Process improvement initiatives
• New product development planning
• Audit preparation and gap closure
The tool supports structured planning, which aligns well with the process approach required by these standards.
Frequently Asked Questions
What is a Tree Diagram in the New 7 QC Tools?
A Tree Diagram is one of the seven management and planning tools used to break down objectives into detailed actions.
When should a Tree Diagram be used?
It should be used when a problem or goal is complex and requires systematic analysis and planning.
Is a Tree Diagram useful for root cause analysis?
Yes. It helps expand causes into deeper levels, enabling identification of underlying issues.
Can Tree Diagrams be used in service industries?
Absolutely. They are useful in manufacturing, healthcare, IT, logistics, and any field requiring structured planning.
Tree diagram example
A Hotel manager wants to improve the satisfaction level of his customer. A brainstorming session was done to identify the various factors improving customer satisfaction. These factors were grouped and converted into a tree diagram as below:
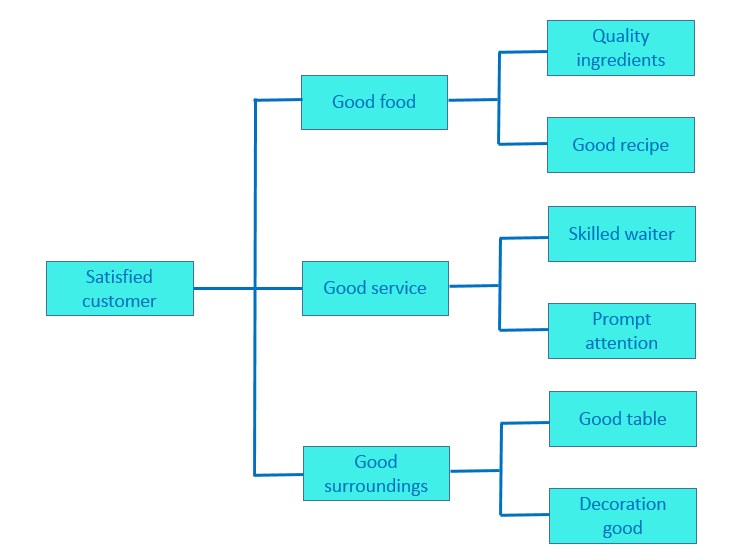
By identifying the factors influencing customer satisfaction, data was collected on a regular basis and required necessary actions are taken on the factors affecting customer satisfaction.
Conclusion
A Tree Diagram is a powerful planning and problem-solving tool that helps organizations convert broad goals into specific, achievable actions. By systematically breaking down objectives into manageable components, teams gain clarity, improve coordination, and increase the likelihood of successful implementation.
In quality management environments such as ISO 9001, IATF 16949, Lean, and Six Sigma, this tool plays a vital role in structured decision making and continuous improvement.
Organizations that consistently use tree diagrams can address complex challenges more effectively and ensure that improvement initiatives deliver measurable results.
If you need professional support for implementing quality tools, QMS documentation, internal audits, or certification preparation, QC Tools Solutions provides consultancy and training services tailored to manufacturing organizations.