
What is a Cause and Effect Diagram?
A Cause and Effect Diagram is a structured visual tool used to identify, analyze, and organize possible causes of a specific problem or effect. It helps teams systematically explore all potential root causes instead of jumping to assumptions.
This diagram is also known as:
• Fishbone Diagram
• Ishikawa Diagram
• Cause & Effect (C&E) Diagram
• CE Diagram
The main purpose of a cause and effect diagram is to support root cause analysis by clearly linking causes to the problem statement.
Cause and Effect Diagram Meaning
The meaning of a cause-and-effect diagram is simple:
It shows the relationship between a problem (effect) and the factors (causes) that contribute to it.
The “effect” is written at the head of the diagram, while the “causes” branch out like bones of a fish. This structure ensures that all possible causes are considered logically and systematically.
History of the Cause and Effect Diagram
The cause and effect diagram was developed by Kaoru Ishikawa, a Japanese quality expert, in the 1960s. That is why it is often called the Ishikawa diagram.
It became widely used in Total Quality Management (TQM) and later adopted as one of the 7 QC tools because of its simplicity and effectiveness in problem-solving.
Cause and Effect Diagram in 7 QC Tools
The cause and effect diagram in 7 QC tools plays a critical role in identifying root causes of quality problems.
The 7 QC tools are:
- Check Sheet
- Histogram
- Pareto Chart
- Cause and Effect Diagram
- Control Chart
- Scatter Diagram
- Process Flow Diagram
Among these, the fishbone diagram is especially useful when the problem is complex and involves multiple factors.
Cause and Effect Diagram in TQM
In Total Quality Management (TQM), the cause and effect diagram is used to:
• Improve process understanding
• Reduce defects and variation
• Support continuous improvement
• Encourage team-based problem solving
A cause-and-effect diagram in TQM promotes fact-based thinking and prevents trial-and-error solutions.
Structure of a Cause and Effect (Fishbone) Diagram
A typical fishbone diagram has three main parts:
- Effect (Problem Statement)
This is written on the right side of the diagram and clearly defines the issue to be analyzed. - Main Cause Categories
These are the major branches leading to the effect. - Sub-Causes
These are detailed factors contributing to each main cause.
Common Cause Categories (6M Method)
The most commonly used structure is the 6M method, especially in manufacturing.
The 6Ms are:
• Man – People, skills, training, behavior
• Machine – Equipment, tools, maintenance
• Method – Process, procedures, work instructions
• Material – Raw material, components, specifications
• Measurement – Inspection methods, gauges, calibration
• Environment (Mother Nature) – Temperature, humidity, workplace conditions
This standardized approach ensures no important area is overlooked during analysis.
Cause and Effect Diagram Example (Manufacturing)
A simple cause-and-effect diagram example in manufacturing could be:
Effect: High rejection rate in final inspection
Possible causes:
• Man – Operator fatigue, lack of training
• Machine – Tool wear, improper settings
• Method – Incorrect SOP, missing checkpoints
• Material – Poor raw material quality
• Measurement – Instruments/Gauges without calibration
• Environment – Poor lighting, high temperature
This example shows how multiple factors may contribute to a single problem.
Fishbone Diagram in Root Cause Analysis
The fishbone diagram in root cause analysis is used as a brainstorming and structuring tool.
It helps teams:
• Identify all possible causes
• Separate symptoms from real causes
• Focus data collection on critical areas
• Avoid blaming individuals
However, the fishbone diagram itself does not identify the final root cause. It must be supported by data analysis, verification, and validation.
Steps to Create a Cause and Effect Diagram
Follow these steps to prepare an effective cause-and-effect diagram:
Step 1: Define the Problem Clearly
Write a specific, measurable problem statement. Avoid vague definitions.
Step 2: Draw the Main Spine
Draw a horizontal arrow pointing to the problem (effect).
Step 3: Identify Major Cause Categories
Use 6M, 4M, or other suitable categories depending on the process.
Step 4: Brainstorm Possible Causes
Involve cross-functional teams (CFT) to list all potential causes.
Step 5: Add Sub-Causes
Break each main cause into smaller contributing factors.
Step 6: Review and Prioritize
Identify the most likely causes for further investigation.
Cause and Effect Diagram vs 5 Why Analysis
Many quality professionals ask about the difference between the cause and effect diagram and the 5 Whys analysis.
A cause and effect diagram:
• Identifies multiple possible causes
• Works well for complex problems
• Encourages team brainstorming
5 Why analysis:
• Drills down into one cause at a time
• Identifies the root cause by repeated questioning
• Works best after fishbone analysis
In practice, both tools are often used together.
Advantages of Cause and Effect Diagram
Key advantages of using a cause and effect diagram include:
• Structured problem analysis
• Visual clarity
• Team involvement
• Identification of hidden causes
• Support for data-driven decisions
• Improved quality and process control
Because of these benefits, the fishbone diagram is widely used in audits, corrective actions, and continuous improvement projects.
Limitations of the Cause and Effect Diagram
Despite its usefulness, the cause-and-effect diagram has limitations:
• It does not confirm root cause without data
• Effectiveness depends on team experience
• Can become complex if not managed properly
• May include assumptions instead of facts
Therefore, it should always be supported by data analysis and validation (Cause Simulation)
Cause and Effect Diagram in ISO 9001 and IATF 16949
In ISO 9001 and IATF 16949, the cause and effect diagram is commonly used during:
• Nonconformity analysis
• Corrective action planning
• Internal audits
• Customer complaint analysis
Auditors expect organizations to demonstrate systematic root cause analysis, and the fishbone diagram is a widely accepted method.
Common Mistakes while using Fishbone Diagram
Avoid these common mistakes:
• Writing unclear problem statements
• Treating symptoms as causes
• Missing cross-functional input
• Not validating causes with data
• Using the diagram as a conclusion
Correct usage improves effectiveness significantly.
Practical Tips for Effective Cause and Effect Analysis
• Always define the problem clearly
• Involve people from different functions
• Use standard cause categories
• Support causes with data
• Combine with Pareto Chart and 5 Whys analysis
• Update analysis after process changes
These practices ensure long-term improvement rather than temporary fixes.
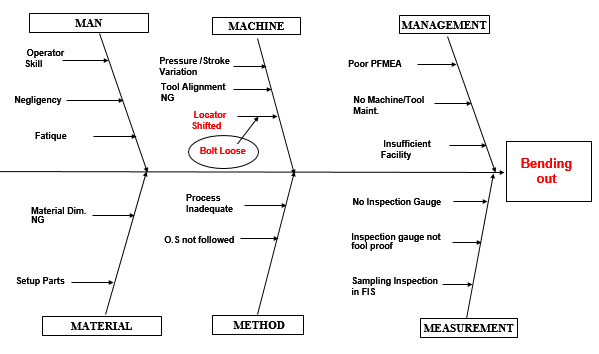
Cause and Effect diagram example:
This is an example of a cause-and-effect diagram of the “Bending out” problem in sheet metal parts.
Conclusion
The Cause and Effect Diagram, also known as the Fishbone or Ishikawa Diagram, is one of the most powerful tools in quality management and root cause analysis. As a key tool in the 7 QC tools, it helps organizations systematically identify and analyze potential causes of problems.
Whether used in manufacturing, service industries, TQM, ISO 9001, or IATF 16949, the cause and effect diagram supports structured thinking, team collaboration, and data-driven decision-making.
When used correctly along with supporting analysis, the cause and effect diagram becomes an essential foundation for effective problem solving and continuous improvement.