Category: 7 QC Tools

Cause and effect diagram 0

Cause and Effect diagram in 7 QC tools?

Cause and Effect Diagram A cause and effect diagram is a graphical tool to identify possible causes of a problem or effect. It is one of the basic tools of 7 QC Tools. The...

Histogram 0

The histogram in 7 QC tools

What is a histogram? The histogram is a graphical view of variation in a set of data. The pictorial nature of the histogram enables us to see patterns easily. But it is very difficult...

Quality control 0

The simple way to learn about quality control

Quality Control Quality control is a process employed to ensure a certain level of quality in a product or service. It includes which actions an organization takes to control and verify certain characteristics of...

Stratification 0

Stratification in quality control in a simple way

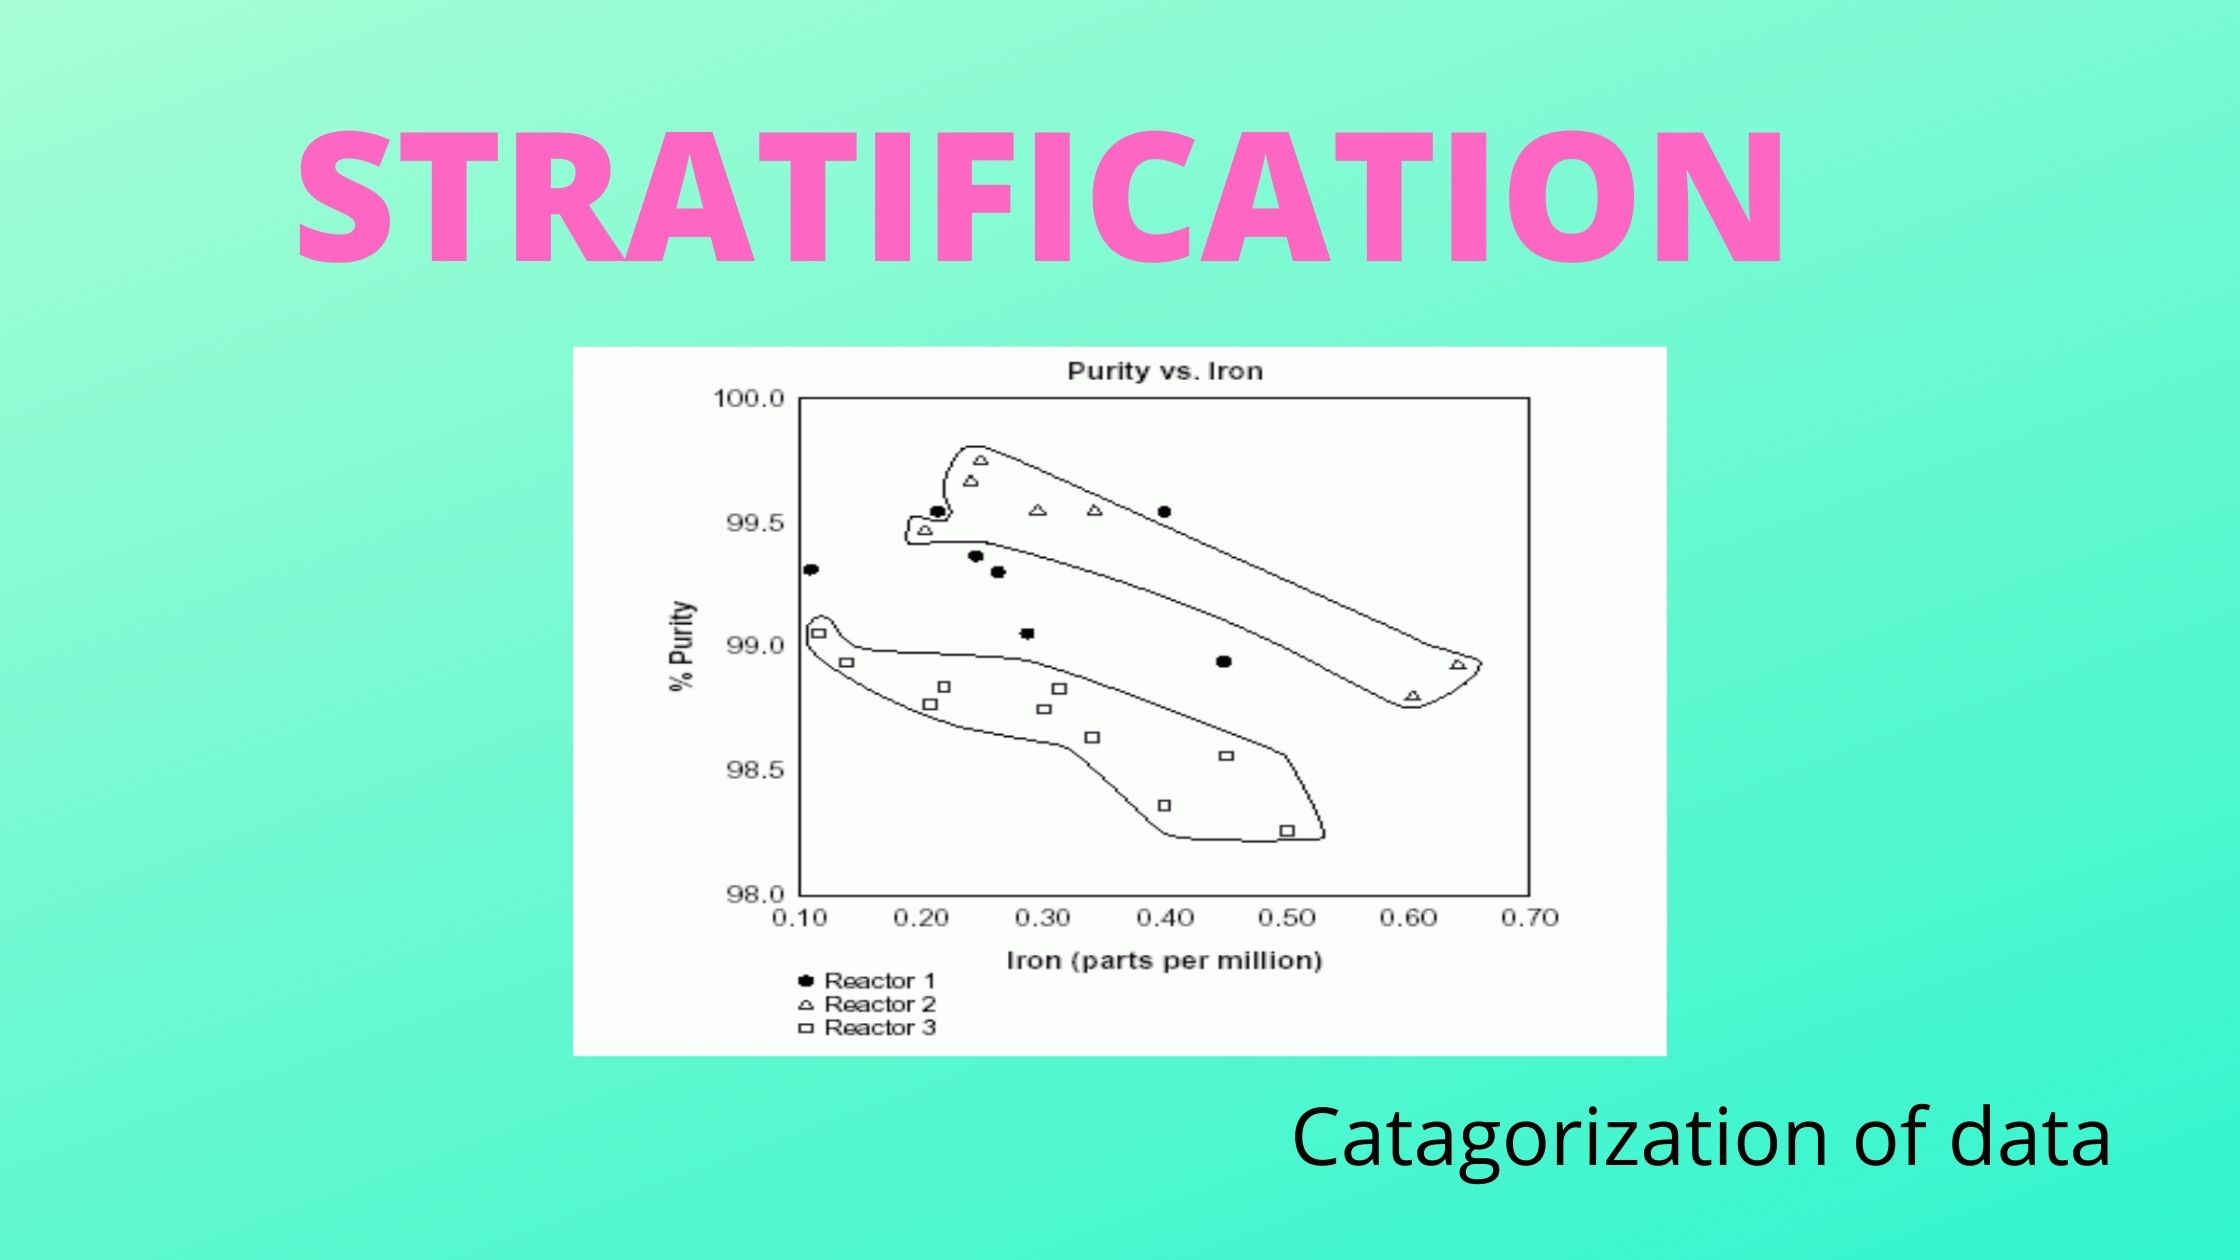
Stratification Stratification is the separation of data into categories. This tool is usually used during the diagnostic process to identify which categories contribute to the problem. We can separate data into different categories so...

Red Bin Analysis 1

How to do Red Bin Analysis?

What is Red Bin Analysis? Red bin analysis is to segregate and verify the defects occurring on production lines including inspection lines on a daily basis by a cross-functional team. Then understand the defects...