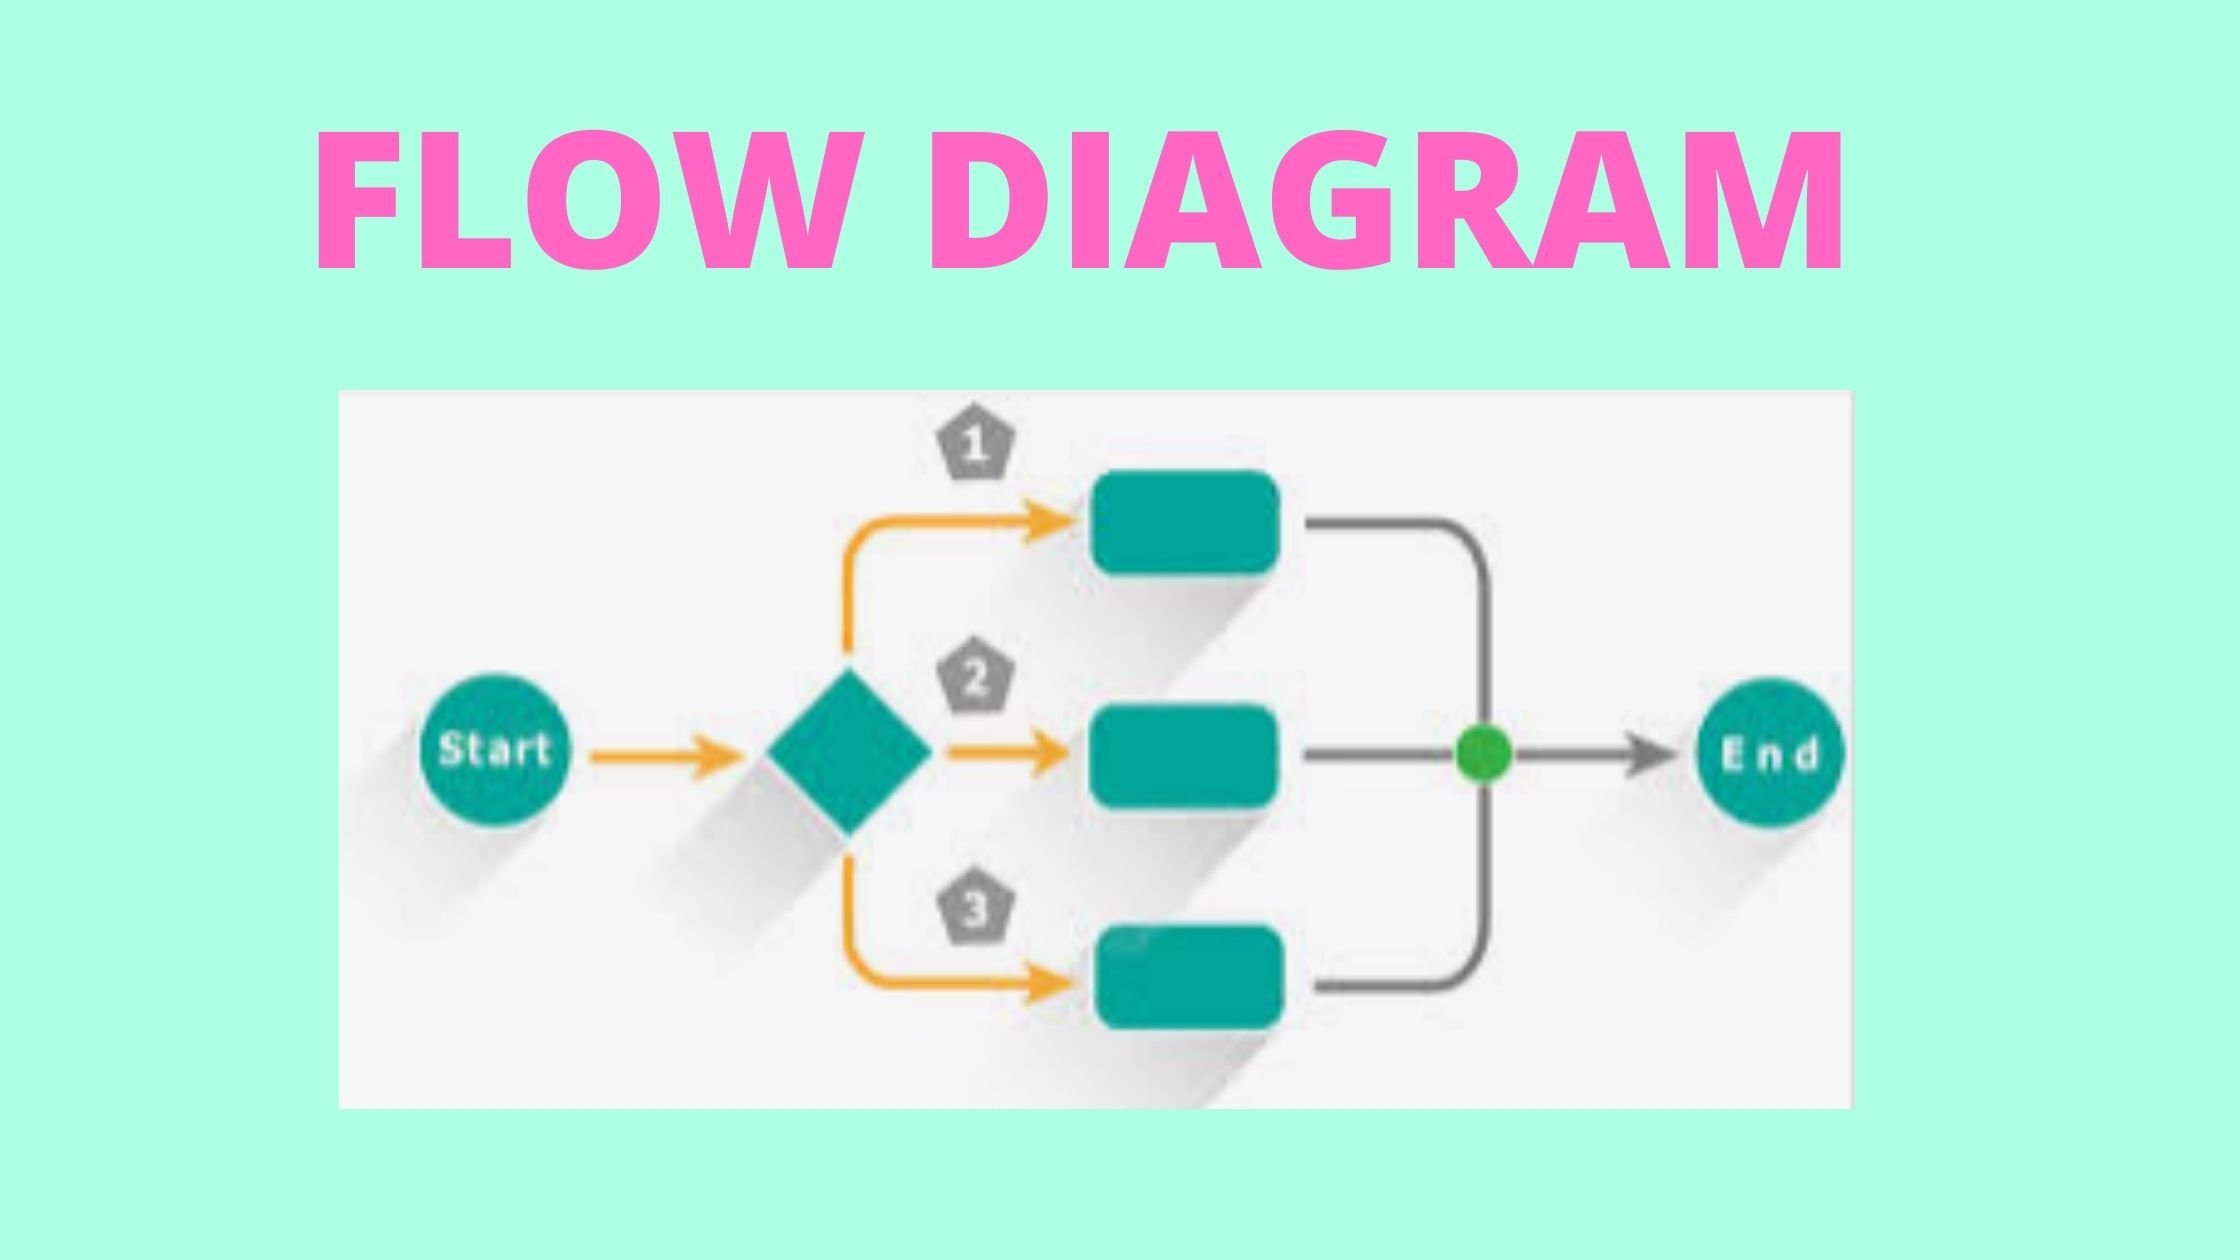
Process Flow diagram :
It is the graphic representation of the sequence of the steps taken to produce an output. The output can be a product, service or combination of both. It is also called a flow diagram or process flow chart. Flow diagram helps us to understand the process easily of how a product is manufactured. It is also the critical part of APQP, which will be defined during the Plan and Define phase. Also during PPAP submission, PFD needs to be submitted.
How do you solve a problem with a flowchart?
A flowchart enables a quality team to go through a process without going to the workplace. Such understanding of the process often sorts out the potential problems, bottlenecks in the system and extra steps etc.
Flow diagram provides the team with a better understanding of the process. It provides a complete understanding of the process to each member of the team easily. So the team takes part in the problem-solving process effectively after understanding the process fully.
When the proper flow diagram is prepared, the team does not need to invest time and energy to observe the process whenever it has to discuss the problem. We can easily identify the problem in any process in the flow diagram and highlight it in the diagram to increase visibility.
Process flow diagram symbols :
- Activity symbol: It is a rectangle, which indicates a single step in the process. A brief description of the process is written inside it.
- Decision symbol: It is a diamond that indicates a decision point in the process. A description of the decision is written inside the symbol usually in the form of a question. The answer to the question determines the path coming out of the decision symbol.
- Storage symbol: It is a triangle that indicates material stored in the process. e.g. Raw material in store.
- Delay symbol: A D-shaped symbol indicates a delay or waiting. e.g. Material waiting for further processing
- Terminal symbol: It is a rectangle with rounded corners. It identifies the start or end of a process.
- Connector: It is a circle, which indicates a continuation of the flow diagram. A number inside the circle shows the link to the other flow diagram.
- Flow Lines: It is the lines, which indicate the flow of the flow diagram.

Types of Process Flow Diagram :
1. High-Level Flow Diagram:
The flow diagram shows the broad flow of the process. The blocks in the high-level flow diagram usually represent the main function. For example, Orders received from customers, manufacturing of a product etc.
2. Detailed Flow Diagram:
The flow diagram describes the details of the blocks of a high-level flow diagram. For example in the case of orders received from customers are as mail received, check for the order, check other details etc.
3. Matrix Flow Diagram:
The flow diagram shows the main activities and processes together with the department in which the process is taking place.
How to interpret Flow diagram :
Flow diagram helps in understanding the process: A flow diagram is a handy tool to gain a better understanding of the process.
Flow diagram analysis provides opportunities to make changes that will result in significant improvements in Quality, Cost and Productivity.
Application of Process Flow Diagram :

- To define the project
- To identify the root cause
- To design the solutions
- To implement the solutions
- To hold the gains
How to construct the process flow diagram:
Group discussion and the free exchange of information are required while constructing a flow diagram. The following steps should be followed for the construction of any flow diagram :
- Discuss how you need to use the flow diagram.
- Decide about the desired result.
- Define the boundaries of the process.
- Document each step in the sequence from the start to the last step.
- When you encounter a decision, select one branch and continue flow diagramming.
- If you have doubts about a segment of the process, make a note and continue.
- Repeat steps no 4,5,6 until you reach the last step in the process.
- Return to make the flow diagram for the other branch from the decision symbol.
- Review the flow diagram for any missing points.
- When you are confident that the flow diagram is OK and complete, analyze it.
Process Flow Diagram Format:
PFD Format template:
You may like the other 7 QC Tools:
A simple example of a process flowchart:
Here’s an example of a simple process flowchart for ordering a product online:

In this example, the process starts with the customer placing an order, followed by payment processing. The order is then processed, followed by shipping and finally, the customer receives the order. The flowchart provides a clear, step-by-step representation of the process, making it easier to understand and analyze.


Well explained thanks for this content
Thanks for your valuable feedback.
It’s is my first time here and this was very knowledgeable for me , thanks MK sir
Share with us in the comments your favorite blog posts of all time!
Actually good and utilitarian details on this internet web site , also I believe the style and style holds excellent capabilities.