What is Stratification in 7 QC Tools?
Stratification is one of the 7 Basic Quality Control (QC) Tools used to separate data into different groups (layers) to identify patterns and root causes of problems.
In simple words, stratification means:
👉 Dividing data into meaningful categories such as machine, operator, shift, material, or supplier.
This helps in understanding where the problem is actually coming from, instead of analyzing mixed data.
For example, if total rejection is high, stratification helps answer:
• Which machine is causing defects?
• Which shift has more rejection?
• Which operator needs training?
- What is Stratification in 7 QC Tools?
- Why Stratification is Important in Quality Control
- Stratification Diagram (Understanding the Concept)
- Types of Stratification in 7 QC Tools
- Stratification Example in Quality Control
- Stratification Chart
- When to Use Stratification
- Benefits of Stratification
- Stratification vs Other QC Tools
- Common Mistakes in Stratification
- What is the use of stratification?
- Importance of stratification in quality control
- What are the precautions in the use of stratification?
- How to stratify?
- How to interpret stratification?
- Frequently Asked Questions (FAQ)
- Conclusion
Why Stratification is Important in Quality Control
Stratification plays a key role in problem-solving and root cause analysis.
It helps to:
• Identify hidden problems
• Separate mixed data into useful groups
• Improve decision-making
• Support tools like Pareto and Histogram
• Reduce trial-and-error in analysis
Without stratification, data can be misleading and may lead to wrong decisions.
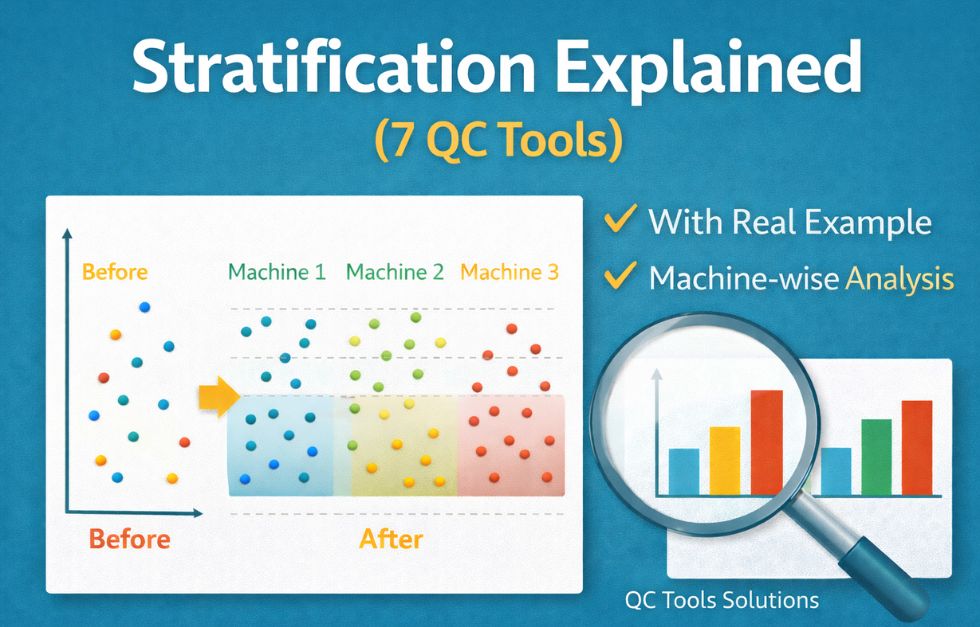
Stratification Diagram (Understanding the Concept)
A stratification diagram shows how mixed data is divided into meaningful groups.
👉 Before Stratification:
All data is combined → No clear pattern
👉 After Stratification:
Data is grouped → Problem source becomes visible
This visual clarity is why stratification is widely used in manufacturing and audits.
Types of Stratification in 7 QC Tools
This is one of the most important sections for practical understanding.
• Machine-wise stratification
Data grouped by different machines
• Operator-wise stratification
Data grouped by operators or workers
• Shift-wise stratification
Morning, evening, night shift comparison
• Material-wise stratification
Different raw material batches
• Supplier-wise stratification
Performance comparison of suppliers
• Time-based stratification
Day-wise, week-wise, or month-wise data
👉 Selecting the correct type is critical for accurate analysis.
Stratification Example in Quality Control
Example:
A company is facing high rejection in production.
Total rejection data does not show the exact cause.
After applying stratification:
• Machine 1 → 5% rejection
• Machine 2 → 7% rejection
• Machine 3 → 18% rejection
👉 Conclusion:
Machine 3 is the major contributor
Action taken:
• Machine calibration
• Tool replacement
Result:
Rejection reduced significantly
This is how stratification helps in real industrial problem-solving.
Stratification Chart

Stratification itself is not a graph, but the results of stratification are often shown using charts such as:
• Bar chart
• Pareto chart
• Histogram
👉 Important:
Stratification is a data analysis technique, not a separate chart. Stratified data is often further analyzed using Histogram in 7 QC Tools to understand data distribution.
When to Use Stratification
Use stratification when:
• Data comes from multiple sources
• Problem source is unclear
• Variation is high
• You need root cause identification
It is especially useful during:
• Internal audits
• Process analysis
• PPAP submissions
Benefits of Stratification
• Identifies root causes quickly
• Improves problem-solving accuracy
• Reduces data confusion
• Enhances decision-making
• Works effectively with other QC tools
After stratification, you can use Pareto Chart in 7 QC Tools to identify major problem areas.
Stratification vs Other QC Tools
Understanding the difference is important:
• Histogram → Shows data distribution
• Pareto Chart → Shows priority of problems
• Stratification → Separates data into groups
👉 Stratification is often the first step before using other QC tools. After stratification, process stability can be monitored using Control Chart in SPC.
Common Mistakes in Stratification
Avoid these mistakes:
• Selecting wrong grouping factor
• Mixing unrelated data
• Using insufficient data
• Assuming subgroup is the final root cause
• Ignoring small but critical variations
What is the use of stratification?
- To categorize data from different sources like machines, operators, dates, and suppliers.
- Stratifying customer complaints by type of complaint or type of customer can help in identifying the important problems.
- It is useful in focusing the investigation on the most serious symptoms and indicating where to look for the root cause.
- Stratification help in testing theories in the case of cause and effect diagram.
- It is useful to stratify data on the new performance level by the variable used during the diagnostic process.
Importance of stratification in quality control
- It ensures all subgroups are added and their accuracy
- It identifies variations in each sub-group.
- It minimizes error compared to random sampling
- It ensures easy and cost-effective quality control
- Identify higher risk area
- Addresses specific quality issues
What are the precautions in the use of stratification?
- Small differences between data classes should not be taken into consideration.
- It should not be considered that the abnormal category is the cause of the problem.
- When there is a need to collect new data, there must be an effort to collect as much identifying information as required for stratification.
How to stratify?
Step 1: Select the stratification variables: When new data are collected, make sure that all potential stratification variables are included like a machine, operator, date etc.
Step 2: Establish categories for each stratification variable: A category is a value or range of value of a stratification variable. For example dates of the month are 1 to 31.
Step 3: Sort observations into categories of one of the stratification variables.
Step 4: Calculate the phenomenon measured for each category. Collect the data date-wise.
Step 5: Display the result. Usually graphic displays are the most effective.
Step 6: Prepare and display the results for additional stratification variables.
Step 7: Plan for additional confirmation.
How to interpret stratification?
It is usually best to present the stratification result in graphic form. If the stratification results are in bar graph form. It will be easy to see the categories of the variables to see whether one or more of the categories stand out.
- Does one machine has a higher defect rate?
- Does one operator have a higher defect rate?
- Is the shift or specific date the reason for the high defect rate?
After stratification, if the result provides a clear indication of the likely source of the phenomenon being studied. Then the team has to validate their initial result. If we do not get any useful results then see the other variables with each category.
Frequently Asked Questions (FAQ)
What is stratification in 7 QC tools?
Stratification is a method of dividing data into groups to identify patterns and root causes.
What are types of stratification?
Machine-wise, operator-wise, shift-wise, material-wise, supplier-wise, and time-based.
What is stratification example in quality?
Grouping rejection data by machine to identify which machine is causing defects.
What is stratification chart?
Stratification itself is not a chart but results are shown using bar charts, Pareto charts, or histograms.
Conclusion
Stratification is a simple yet powerful QC tool that helps in identifying the true source of problems by separating data into meaningful groups. When used correctly, it improves analysis accuracy, supports decision-making, and reduces defects in manufacturing processes.
Stratification is one of the 7 basic quality tools by ASQ, widely used in quality management systems. For quality professionals and engineers, mastering stratification is essential for effective problem-solving and continuous improvement.
Glad I observed this on google .