What is Statistical Process Control (SPC)?
Statistical Process Control (SPC) is a method of monitoring and controlling a manufacturing or service process using statistical techniques. It helps identify variations, detect problems early, and ensure consistent product quality.
SPC primarily uses control charts to distinguish between normal process variation and abnormal variation caused by specific issues such as machine problems, material defects, or operator errors.
Statistical Process Control is one of the core methods used in quality improvement to monitor and control processes. When abnormal variation is detected, techniques such as Root Cause Analysis are applied to identify and eliminate underlying problems. According to the American Society for Quality, SPC enables organizations to achieve consistent product quality through data-driven decision-making.
SPC is widely used in automotive, aerospace, electronics, and general manufacturing industries, especially in organizations certified to ISO 9001 and IATF 16949.
- What is Statistical Process Control (SPC)?
- Why SPC is Important in Manufacturing
- Types of Variation in a Process
- Control Charts — The Core Tool of SPC
- Control Chart Example
- SPC Calculation Formulas
- Control Chart vs Histogram — Key Differences
- When should SPC be applied?
- Advantages of implementing SPC
- SPC in ISO 9001 and IATF 16949
- SPC vs Statistical Quality Control (SQC)
- SPC vs Six Sigma
- SPC vs Final Inspection
- Practical Tips for Successful SPC Implementation
- Best Practices for Effective SPC Implementation
- Future of Statistical Process Control
- Frequently Asked Questions (FAQs)
- More definition from SPC
- SPC Format free download:
- Conclusion
Why SPC is Important in Manufacturing
Modern industries cannot rely only on final inspection. Defects must be prevented during production. SPC enables organizations to control the process rather than detect defects after they occur.
Key benefits of SPC include:
• Reduction in rejection and rework
• Improved process stability
• Lower production costs
• Better customer satisfaction
• Data-based decision making
• Compliance with quality standards (IATF 16949)
Companies implementing SPC effectively often achieve significant improvements in productivity and profitability.
Types of Variation in a Process
SPC classifies process variation into two categories.
Common Cause Variation
This is natural variation inherent in the process. It occurs due to small factors such as minor machine vibration, temperature changes, or normal material differences. Common cause variation is predictable and stable over time.
It is also called white noise. Some examples of common cause variation are machine parts wear and tool wear.
Special Cause Variation
This variation occurs due to unusual or assignable factors such as tool breakage, incorrect machine settings, operator mistakes, or faulty material. Special causes must be identified and eliminated immediately.
SPC tools help distinguish between these two types.
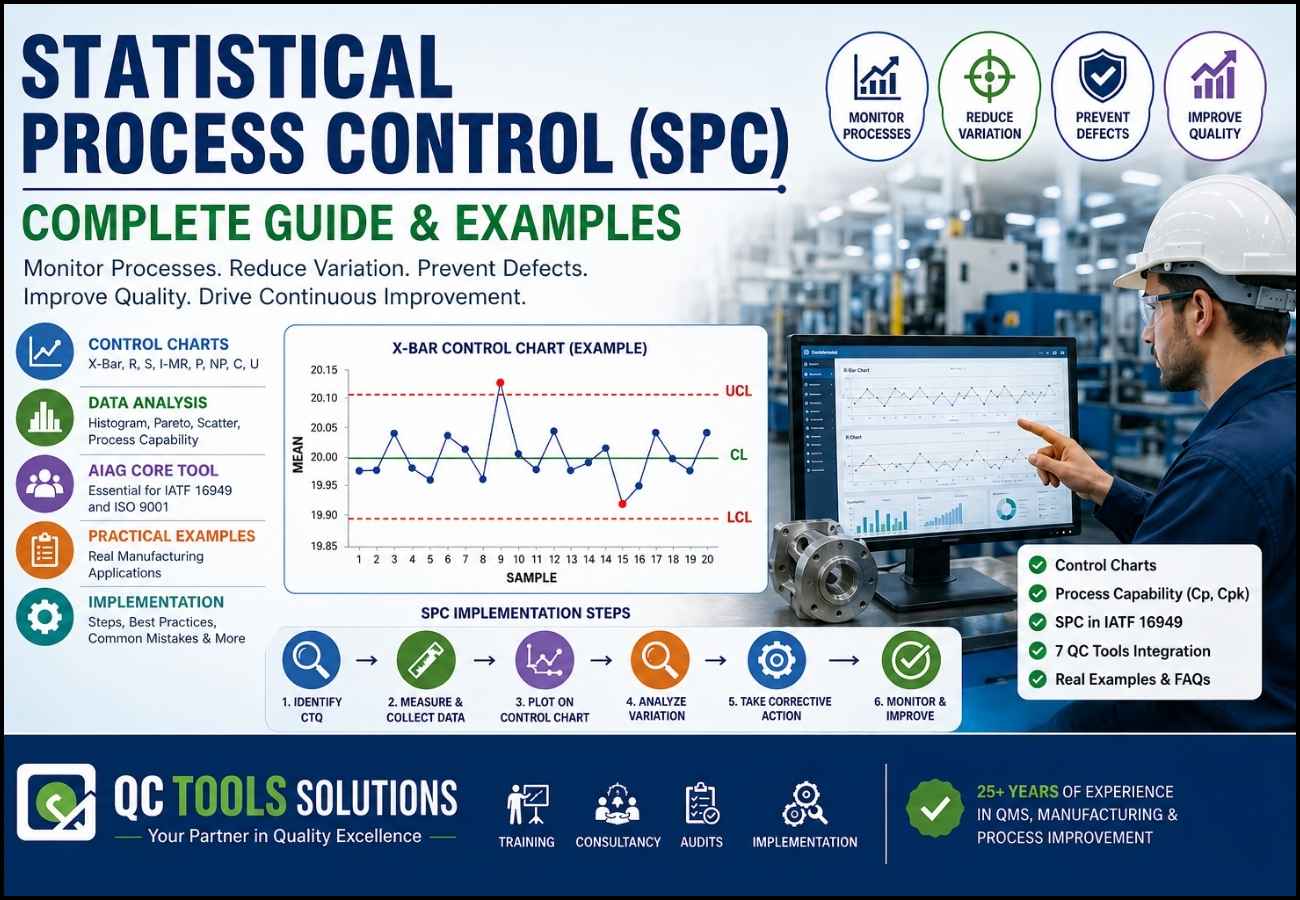
Control Charts — The Core Tool of SPC
A control chart is a graphical tool used to monitor process behavior over time. It plots measured data against statistically calculated limits.
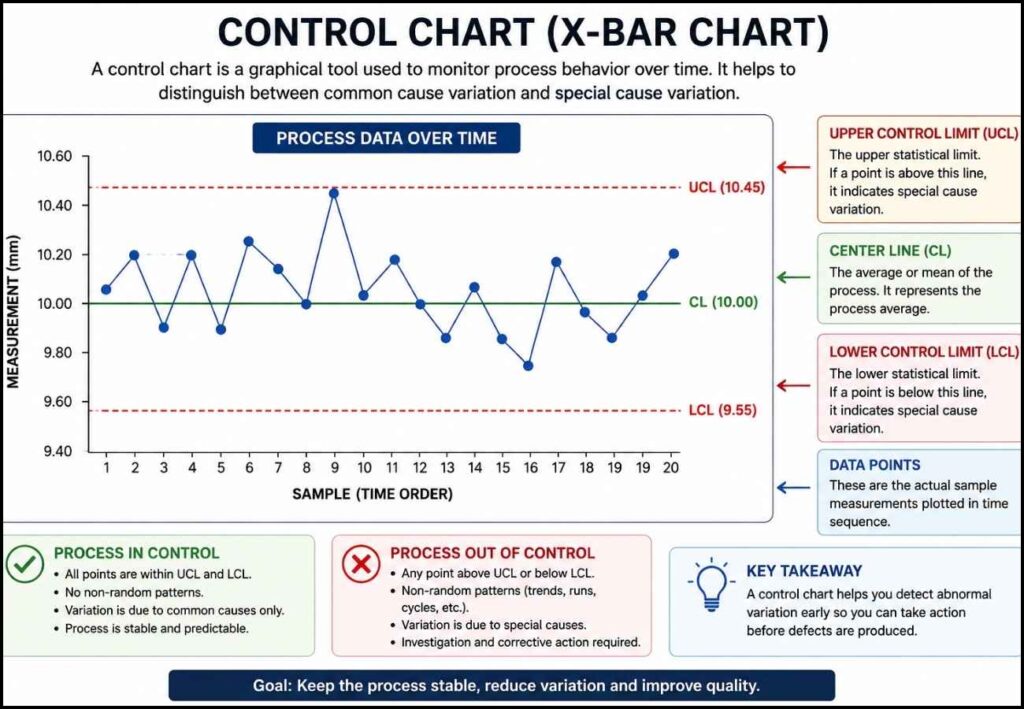
A typical control chart contains:
• Center Line (CL) — Process average
• Upper Control Limit (UCL)
• Lower Control Limit (LCL)
• Data points plotted over time
If points fall outside control limits or show abnormal patterns, the process may be out of control.
Common Types of Control Charts
Variable Data Charts
Used for measurable characteristics such as length, weight, or diameter.
• X̄-R Chart — Most widely used for subgroup data
• X̄-S Chart — Used for larger sample sizes
• I-MR Chart — Used when data is collected individually
Attribute Data Charts
Used for count data or defect information.
• p Chart — Proportion defective
• np Chart — Number of defectives
• c Chart — Number of defects
• u Chart — Defects per unit
Selecting the correct chart depends on the type of data and sampling method.
Control Chart Example
Consider a process producing shafts with a target diameter of 20 mm. Every hour, five samples are measured and recorded.
Steps to create an X̄-R chart:
- Collect subgroup data
- Calculate subgroup averages
- Calculate ranges (max − min)
- Find overall average (X̄̄)
- Calculate average range (R̄)
- Determine control limits using SPC constants
- Plot the values on the chart
- Analyze patterns and signals
If all points remain within limits and show random behavior, the process is statistically controlled.
SPC Calculation Formulas
Mean (Average)
X̄ = Sum of observations / Number of observations
Range
R = Maximum value − Minimum value
Average Range
R̄ = Sum of subgroup ranges / Number of subgroups
Control Limits for X̄ Chart
UCL = X̄̄ + A2 × R̄
LCL = X̄̄ − A2 × R̄
(A2 is a constant based on sample size)
These formulas allow engineers to monitor process stability scientifically.
Control Chart vs Histogram — Key Differences
Many beginners confuse these two tools, but they serve different purposes.
| Feature | Control Chart | Histogram |
|---|---|---|
| Shows time sequence | Yes | No |
| Detects process stability | Yes | No |
| Displays data distribution | Limited | Yes |
| Used for real-time monitoring | Yes | No |
| Identifies trends | Yes | No |
A histogram shows how data is distributed, while a control chart shows how the process behaves over time.
When should SPC be applied?
SPC should be used when:
• Process output is measurable
• Data can be collected periodically
• Process stability is critical
• Quality improvement is required
• Customer specifications are strict
In automotive and aerospace industries, SPC is often mandatory for critical characteristics.
Advantages of implementing SPC
Organizations using SPC gain long-term competitive advantages.
Major benefits include:
• Early detection of problems
• Reduction in scrap and rework
• Improved process capability
• Consistent product quality
• Lower inspection costs
• Stronger customer confidence
SPC shifts the focus from inspection to prevention.
SPC in ISO 9001 and IATF 16949
Quality management standards emphasize process control and data-driven decision making. SPC supports these requirements by providing objective evidence of process stability and capability.
In automotive supply chains, SPC is essential for:
• Critical characteristic monitoring
• PPAP documentation
• Supplier performance evaluation
• Continuous improvement programs
Proper implementation helps organizations meet stringent audit requirements.
SPC vs Statistical Quality Control (SQC)
Many professionals confuse SPC with Statistical Quality Control (SQC), but they are different concepts.
| SPC | SQC |
|---|---|
| Focuses on controlling the production process | Covers overall statistical quality methods |
| Prevents defects | Prevents and detects defects |
| Uses control charts | Includes sampling inspection, SPC, capability analysis, and acceptance sampling |
| Process-oriented | Quality system-oriented |
In simple terms, SPC is a subset of SQC.
SPC vs Six Sigma
Both SPC and Six Sigma aim to improve quality, but their objectives differ.
| SPC | Six Sigma |
|---|---|
| Monitors ongoing production | Improves business processes through projects |
| Detects abnormal variation | Reduces process variation using DMAIC |
| Uses control charts | Uses statistical analysis and project management tools |
| Continuous monitoring | Structured improvement methodology |
Organizations often use SPC during routine production and Six Sigma for major process improvement projects.
SPC vs Final Inspection
Traditional inspection identifies defects after production, whereas SPC prevents defects during production.
| SPC | Final Inspection |
|---|---|
| Preventive approach | Detection approach |
| Monitors the process | Inspects finished products |
| Reduces waste | Identifies defective products |
| Improves process performance | Does not improve the process itself |
Because prevention is less expensive than correction, SPC significantly reduces manufacturing costs.
Practical Tips for Successful SPC Implementation
To gain maximum benefit from SPC:
• Train operators and engineers properly
• Use accurate measuring instruments
• Select appropriate sampling frequency
• Investigate special causes immediately
• Maintain data integrity
• Review charts regularly
SPC should be integrated into daily production activities, not treated as a paperwork exercise.
Best Practices for Effective SPC Implementation
Organizations can maximize the benefits of SPC by following these best practices:
- Identify Critical-to-Quality (CTQ) characteristics.
- Select the appropriate control chart for the data type.
- Verify the measurement system using MSA before collecting data.
- Train operators on interpreting control charts.
- React immediately to out-of-control signals.
- Conduct regular process capability studies.
- Review SPC data during production meetings.
- Integrate SPC with Control Plans and Layered Process Audits.
Common Mistakes in SPC Implementation
- Selecting the wrong control chart for the data.
- Using an unverified measurement system (MSA not performed).
- Collecting insufficient or inaccurate data.
- Ignoring out-of-control signals.
- Confusing control limits with specification limits.
- Lack of employee training on SPC.
- Failing to investigate and implement corrective actions.
Tip: Ensure accurate measurements, choose the appropriate control chart, train employees, and respond promptly to abnormal process variations to implement SPC effectively.
Future of Statistical Process Control
Manufacturing is rapidly evolving with Industry 4.0 technologies. Traditional SPC is now being combined with artificial intelligence (AI), machine learning, cloud computing, and Industrial Internet of Things (IIoT) to create intelligent quality management systems.
AI-Based SPC
Artificial Intelligence can analyze thousands of process variables simultaneously, detect hidden patterns, and predict quality issues before they occur.
Real-Time Process Monitoring
IoT sensors continuously collect production data from machines, allowing real-time control charts and instant alerts when abnormal variation is detected.
Predictive Quality
Instead of reacting to process problems, predictive analytics forecasts future process behavior and recommends preventive actions.
Digital Manufacturing
Smart factories integrate SPC with Manufacturing Execution Systems (MES), Enterprise Resource Planning (ERP), and Quality Management Systems (QMS), creating a connected manufacturing environment.
As Industry 4.0 adoption increases, SPC will continue evolving from manual charting to intelligent, automated process monitoring.
Frequently Asked Questions (FAQs)
1. What is Statistical Process Control (SPC)?
SPC is a statistical method used to monitor, control, and improve manufacturing processes by reducing process variation.
2. Why is SPC important?
It helps prevent defects, improve process stability, reduce waste, and increase customer satisfaction.
3. What is the difference between control limits and specification limits?
Control limits indicate actual process performance, while specification limits define customer requirements.
4. Which industries use SPC?
Automotive, aerospace, electronics, pharmaceuticals, food processing, medical devices, and general manufacturing.
5. What is the most commonly used SPC tool?
The Control Chart is the primary tool used for monitoring process stability.
6. Is SPC mandatory in IATF 16949?
Organizations are expected to use appropriate statistical techniques for process monitoring, especially for critical characteristics.
7. Can SPC be implemented using Excel?
Yes. Small and medium-sized organizations often use Microsoft Excel before adopting specialized SPC software.
8. What is a stable process?
A stable process exhibits only common cause variation and remains statistically in control over time.
9. What is process capability?
Process capability measures how well a stable process meets customer specification limits using indices such as Cp and Cpk.
10. How often should SPC data be reviewed?
The review frequency depends on the process risk, production volume, and customer requirements. Critical processes are typically monitored continuously or at predefined sampling intervals.
More definition from SPC
Statistical Process Control (SPC)?
SPC controls process variation using statistical techniques. Statistical techniques such as Control charts and histograms are used to analyze the process & achieve & maintain a state of statistical control to get a product with no defects.
What is Statistics?
It is information derived from the sample data to estimate the process. It includes collecting of data, data analysis, data interpretation & taking actions based on the analysis.
What is Statistical Control?
The condition describes a process from which all special causes of variation have been eliminated & only a common cause exists.
What is a Process?
The process is converting input into output by using resources i.e. man, machine, material & method, under controlled conditions. Also during this conversion, value is added.
What is Variation?
The inevitable difference among the individual outputs of a process is called variation. As we know, no two things can be produced the same in the world. In other words, we can say the dissimilarity between two products for the same dimension is called variation.
Process Stability:
The process will be stable when the process is in control & variation is constant over time.
What is Mean:
The mean of ‘n’ values is the sum of all the values divided by ‘n’.
X = (X1+X2+X3+X4+ …………+Xn)/n
What is Range:
The difference between the largest value & smallest value of a set of numbers.
R = X max – X min
What is Spread ( Standard Deviation):
Standard deviation is the average distance between the individual numbers and the mean.
Standard deviation formula:
Standard Deviation (Sigma) = R/d2
where R is the average of the subgroup range
d2 is constantly varying with the sample size.
Process capability can be described in terms of the distance of the process average from the specification limit in standard deviation unit Z
Process Capability Index:
Cpk = Min ( (USL – X bar)/3 Sigma & (X bar – LSL)/3 Sigma)
Process Capability :
It is the measurement of the inherent variation of the process when it is in stable condition for process specification.
Cp = (USL – LSL) / 6 sigma
SPC Format free download:
Conclusion
Statistical Process Control is one of the most powerful tools for ensuring consistent quality and operational excellence. By monitoring process variation using statistical techniques (Control charts & Histogram), organizations can prevent defects, reduce costs, and improve customer satisfaction.
Companies that implement SPC effectively move from reactive quality control to proactive process management — a key requirement for world-class manufacturing.
🚀 Need expert support in implementing SPC, ISO 9001, or IATF 16949 systems? QC Tools Solutions provides professional QMS consultancy to help organizations achieve compliance and operational excellence.
very nice explanation