
Process Capability
Process capability is a statistical measure of the ability of a process to consistently produce output within specification limits. It quantifies the ability of a process to meet customer requirements and expectations. It is done by assessing the spread and centering of process output relative to predetermined specifications.
Process capability is a statistical measure used to assess the capability of a process to meet specifications or requirements. It compares the spread of the process output to the spread of the specifications.
Cp is calculated as the ratio of the specification width to the process spread.
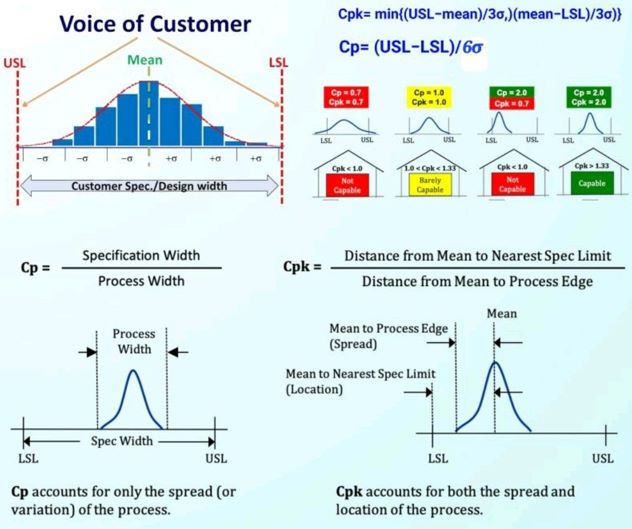
Image Credit: TQMI
Calculating process capability cp and cpk
Define Specifications:
Determine the upper specification limit (USL) and lower specification limit (LSL). These are the acceptable limits for a particular process.
Collect Data:
Gather data points from the process. This data should be representative of the typical variation in the process.
Calculate Process Mean (µ) and Standard Deviation (σ):
- Calculate the mean (average) of the data, representing the process’s center.
- – Calculate the standard deviation, which quantifies the spread or dispersion of the data.
Calculate Cp:
- Cp is calculated by dividing the specification width of the process by six times the standard deviation.
- Cp indicates how well the process can fit within the specification limits. A value of 1 means the process is just capable, while values greater than 1 indicate better capability.
Calculate Cpk:
Cpk is a more refined measure that accounts for the process mean. It is calculated by taking the minimum of the difference between the mean and the specification limits, divided by three times the standard deviation. Cpk indicates how centered the process is within the specification limits. A value of 1 or higher is generally desirable.
Interpretation:
- If Cp and Cpk are greater than 1, it indicates that the process is capable of meeting specifications.
- If Cp is greater than 1 but Cpk is less than 1, it suggests that the process is not centered within the specifications.
- If both Cp and Cpk are less than 1, the process is not capable of meeting specifications.
- Cp measures the overall capability of the process, while Cpk takes into account both capability and centering. High values for Cp and Cpk suggest a capable and well-centered process, which is desirable for maintaining quality and consistency.
Cp is a measure of the potential capability of a process to meet the specifications, assuming that the process is centered on the target value.
This index simply compares the width of the process spread (defined by the process variability or the standard deviation) with the width of the tolerance range.
Process capability index (Cp)
The formula for Cp is as follows:
Cp = (Upper Specification Limit – Lower Specification Limit) / (6 * Standard Deviation)
Cp calculation example
Let’s assume we have a process with a target value of 10, an upper specification limit of 12, a lower specification limit of 8 and a standard deviation of 0.5. Calculating Cp by the formula, we get:
Cp = (USL – LSL)/ 6σ
Cp = (12 – 8) / (6 * 0.5) = 4 / 3 = 1.33
In this formula:
- The Upper Specification Limit (USL) is the maximum acceptable value for the output.
- The Lower Specification Limit (LSL) is the minimum acceptable value for the output.
- Standard Deviation is a measure of the variability of the process output.
A Cp value greater than 1 indicates that the process spread is less than the specification spread, meaning the process is capable of producing within specifications. However, Cp alone does not consider the centering of the process within the specification limits.
For a more comprehensive assessment that considers both the spread and centering of the process output, the Process Capability Index accounting for centering (Cpk) is often used.
Process Capability Index (Cpk):
The Process Capability Index accounting for centering (Cpk) is a statistical measure that assesses the capability of a process to meet specifications, while also considering the process centering relative to the specification limits. Cpk indicates how well the process is centered within the specification limits.
Cpk is an extended version of Cp that takes process centering into account.
It measures how well the process is centered within the tolerance range. Cpk considers both the spread of data and the deviation from the target value.
The formula for calculating Cpk depends on whether the process is centered on the target value or not. There are two scenarios:
- When the process is centered on the target value
- When the process is not centered on the target value
Cpk=min((USL−Mean/(3×Standard Deviation), (Mean−LSL)/(3×Standard Deviation))
In both scenarios:
- The mean is the average value of the process output.
- Standard Deviation is a measure of the variability of the process output.
- USL (Upper Specification Limit) is the maximum acceptable value for the output.
- LSL (Lower Specification Limit) is the minimum acceptable value for the output.
The formula for Cpk is as follows:
Cpk = Min(Cp Upper, Cp Lower)
= Min[(Upper Specification Limit – Process Mean) / (3 * Standard Deviation), (Process Mean – Lower Specification Limit) / (3 * Standard Deviation)]
Cpk calculation example
Assuming the process mean (average) is 11, the target value is 10 (USL 12 & LSL 8), and the standard deviation (0.5), we get:
Cpk Upper = (12 – 11) / (3 * 0.5) = 1 / 1.5 = 0.67
Cpk Lower = (11 – 8) / (3 * 0.5) = 3 / 1.5 = 2
We will consider the minimum of the above value because the process risk is on the lower side.
So Cpk in this case is 0.67
Comparison Table Process Width, Process Capabilities and Rejection:
| Parameter | @6σ | @8σ | @10σ | @12σ |
|---|---|---|---|---|
| USL – LSL | 6σ | 8σ | 10σ | 12σ |
| Cp | 1.00 | 1.33 | 1.66 | 2.0 |
| Rejects | 0.27% | 64 ppm | 0.6 ppm | 2 ppb |
| % of spec used | 100 | 75 | 60 | 50 |
Cpk provides a more comprehensive assessment of process capability as compared to Cp because it accounts for both the spread and centering of the process output relative to the specification limits. A Cpk value greater than 1 indicates that the process is capable of producing within specifications, with higher values indicating better capability.
You may like to know more about Statistical Process Control (SPC)
Process Capability Example:
Let’s consider a manufacturing industry that produces shafts. The specifications for these shafts require them to have a diameter between 4.9 and 5.1 millimeters. Process capability in this context would determine if the manufacturing process can consistently produce shafts within this specified diameter range.
Data Collection:
- The manufacturing company collects data on the diameter of a sample of shafts produced using their manufacturing process. Let’s say they measure the diameter of 30 randomly selected shafts.
Calculation of Process Capability Indices:
- The company calculates the average diameter of the sample (mean).
- They also calculate the standard deviation of the diameters, which indicates the variability in the production process.
- Using these values, they calculate the Process Capability Index (Cp) and the Process Capability Index accounting for centering (Cpk).
Interpretation:
- If Cp > 1 and Cpk > 1, it means the manufacturing process is capable of consistently producing shafts within the specified diameter range, and it’s centered well within this range.
- If Cp > 1 but Cpk < 1, it suggests that while the process spread is within specifications, the process may not be consistently centered within the desired diameter range.
- If Cp < 1, it indicates that the process spread is wider than the specifications, meaning the process may not consistently produce shafts within the specified diameter range.
- Yes, it is possible to have poor Cpk (below 1) & still your process remains within specifications.
Difference between Process capability and Process capability index:
| Process Capability (Cp) | Process Capability Index (Cpk) |
|---|---|
| It considers the spread of the process | It considers both the spread and the mean |
| Cp focuses on potential capability without considering the mean. | Cpk accounts for the actual process mean and its alignment with specification limits. |
| Cp does not indicate how well the process is centered. | Cpk provides insight into both variability and centering, making it a more practical measure for assessing process performance. |
| Cp determines the capability of producing to the specification | Cpk measures how centered the process is |
Continuous Improvement:
- Based on the process capability analysis, the manufacturing company can identify areas for improvement. They may adjust machinery settings, fine-tune production processes, or improve quality control measures to ensure more consistent production within the specified diameter range.
By assessing process capability in this manufacturing example, the company can maintain quality standards, minimize defects, and ultimately enhance customer satisfaction with its shafts. Process capability analysis helps organizations identify and understand the inherent variability of their processes, enabling them to make informed decisions for quality improvement and assurance initiatives.
Good ?V I should certainly pronounce, impressed with your web site. I had no trouble navigating through all tabs and related info ended up being truly easy to do to access. I recently found what I hoped for before you know it at all. Reasonably unusual. Is likely to appreciate it for those who add forums or something, web site theme . a tones way for your customer to communicate. Excellent task..